This page has some summaries of the raw data that was used/generated for our citation analysis research, which led to the following publications
This page was (mostly) automatically generated from our Citation Analysis Scripts (FYI:
the original automatically generated page is here). Our study gathered data from a total of 8764 papers (15 conferences with 3258 papers and 17 journals with 5506 articles).
Please get in contact with the authors if you want more information on this work.
Correlation between ISI Impact Factor and Google Scholar Impact Factor for Selected Journals
There is a strong correlation between citation counts computed from Google Scholar data and comparable data from the ISI Web of Knowledge index, validating the use of our new Google Scholar Impact Factor as an alternative citation-based evaluation metric applicable to both journals and conferences. The Pearson correlation coefficient between the two is 0.86. The table below shows the raw values.
ISI and Google Scholar Impact Factors for Selected Journals
| Category | Journal Name | ISI Impact Factor | GS Impact Factor |
|---|
| A*
| Journal of the ACM | 2.9 | 35 |
| B | Pattern Analysis Applications | 0.4 | 8 |
| A* | Transactions on Knowledge and Data Engineering | 2.1 | 15 |
| A
| Information Retrieal | 1.7 | 9.5 |
| A*
| Artificial Intelligence | 2.3 | 22 |
| B
| AI EDAM | 0.4 | 5 |
| A
| Computational Intelligence | 1.4 | 9 |
| A*
| IEEE Trans. on Pattern Analysis and Machine Intelligence | 4.3 | 34 |
| B
| AI Communications | 0.5 | 4 |
| A
| AI in Medicine | 1.6 | 12 |
| B
| International Journal of Pattern Recognition | 0.5 | 4 |
| A
| Decision Support Systems | 1.2 | 17.5 |
| A*
| Machine Learning | 2.6 | 32.5 |
| A*
| International Journal of Computer Vision | 6 | 27 |
| A
| Data and Knowledge Engineering | 1.4 | 8 |
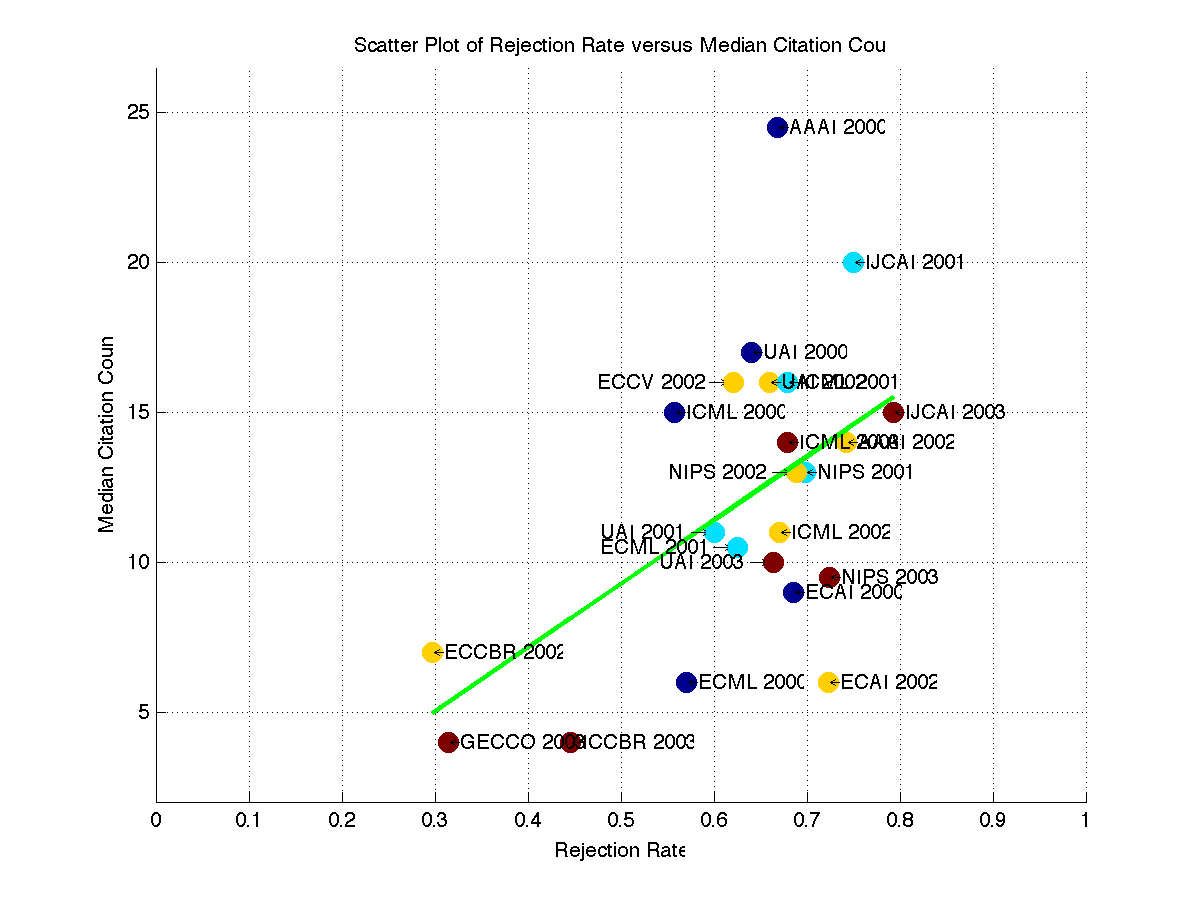
Scatterplot of Available Rejection Rates versus Google Scholar Impact Factors
Below is a scatter plot of GS impact factor against conference rejection rates for 23 conferences across the 15 conference series we evaluated; note the data points reflect a subset of the full set of conferences, namely those for which we were able to obtain. Reliable rejection rates could not be obtained for all of the conferences for which we had data.
More details on the rejection rates we used are below. While our study indicate some correlation between GS impact factor and rejection rates, the related Pearson correlation score of 0.53 was not very convincing and reflects considerable variation when it comes to the relationship between conference rejection rates and a conference paper’s ability to attract citations. There are conferences with similar rejection rates but very different Google Scholar impact factors. There are also conferences with very different rejection rates that still manage to achieve similar GS impact factors. For instance, AAAI achieves a Google Scholar impact factor of 20, with a rejection rate of 65%–75%. Its European counterpart, ECAI the European Conference on Artificial Intelligence, is just as selective but achieves a median GS impact factor of only 7 (see
the section on regional bias below).
Another example of a lack of correlation between paper acceptance rate and citation count is the 2002 European Conference on Case-Based Reasoning (ECCBR), which had a rejection rate of approximately 0.33 33% and Google Scholar impact factor of 7, achieving a citation rate better than the European Conference on Machine Learning?? 2000 and ECAI 2002, which had twice its rejection rate (see
the Section below on open-world versus closed-world bias).
To further test the strength of the correlation between GS impact factor and rejection rate we examined the available data for three conference series that took place between 2000-2003; UAI, ICML, and ECML were the only conferences that occurred and had published rejection rates available in every year of the study. Table 5 outlines the GS impact factors and rejection rates for each year in the study. What is interesting here is there is no significant correlation between rejection rate and GS impact factor. The Pearson score for UAI is was?? only 0.27, for ICML 0.24, and for ECML 0.42. This suggests that, at least for these conferences, the yearly changes in rejection rates had little bearing on expected citation count.
These results highlight the assumption?? the fact?? that any assumed relationship between conference rejection rates and a conference’s ability to attract citations is at best weak, so other factors play a more critical role when it comes to influencing future citations.
Scatter Plot Values
| Conference | Rejection Rate | Google Scholar Impact Factor |
|---|
| UAI 2000 | 0.64 | 17.00 |
| UAI 2001 | 0.60 | 11.00 |
| UAI 2002 | 0.66 | 16.00 |
| UAI 2003 | 0.66 | 10.00 |
| ECAI 2002 | 0.72 | 6.00 |
| NIPS 2001 | 0.70 | 13.00 |
| ECAI 2000 | 0.69 | 9.00 |
| NIPS 2003 | 0.72 | 9.50 |
| AAAI 2000 | 0.67 | 24.50 |
| AAAI 2002 | 0.74 | 14.00 |
| ECCV 2002 | 0.62 | 16.00 |
| ICML 2001 | 0.68 | 16.00 |
| ICML 2000 | 0.56 | 15.00 |
| ICML 2003 | 0.68 | 14.00 |
| ICML 2002 | 0.67 | 11.00 |
| IJCAI 2001 | 0.75 | 20.00 |
| IJCAI 2003 | 0.79 | 15.00 |
| ECML 2001 | 0.62 | 10.50 |
| ECML 2000 | 0.57 | 6.00 |
| NIPS 2002 | 0.69 | 13.00 |
| ECCBR 2002 | 0.30 | 7.00 |
| GECCO 2003 | 0.31 | 4.00 |
| ICCBR 2003 | 0.45 | 4.00 |
We found evidence of strong regional bias between similar conferences, with international (mainly U.S.-centric) conferences attracting much higher citation counts that their similarly selective though less-well-cited European counterparts. Both the AAAI and ECAI conferences target the same research area and attract submissions from a similar community of researchers in a way that is equally selective. Yet the U.S.-centric AAAI enjoys an expected citation count (computed from the product of the median citation count and the rejection rate of the conference) more than twice that of ECAI.
This apparent regional bias is also evident in another pair of related conferences: the International Conference on Machine Learning (ICML) and ECML. Once again, a more U.S.-centric ICML conference series attracts far more citations—twice as many—than a similarly selective Euro-centric ECML conference series. There are several possible explanations: One is that non-European researchers are likely to miss publications at European venues (such as ECAI and ECML), so papers at these conferences pick up references only from European researchers. Another is that a pre-selection process allows researchers to keep their best work for the international conference.
Google Scholar Rates for the International Conference on Machine Learning versus the European Conference on Machine Learning between 2000-2003
| Year | ICML | ECML |
|---|
| 2000 | 15 | 6 |
| 2001 | 16 | 10.5 |
| 2002 | 11 | 7 |
| 2003 | 14 | 5 |
There does not appear to be a case for bias between the International and European Conferences on Case Based Reasoning, although these conferences are held on alternative years, and in ICCBR was held in Norway in 2003. This table is here only because we have the data to show it.
The table below shows a breakdown of the GS Impact Factor count of ECCBR (formally known as EWCBR) versus ECAI. The European Conference on Case Based Reasoning (CBR) ranked almost as highly in 2000 and 2002 as the European Conference on AI conference, which has a much higher rejection rate. This suggests that there is some merit in targeting one's own community and publishing in niche conferences rather than the larger conferences with a more general audience. However, there is not enough evidence here to draw strong conclusions.
Google Scholar Impact Factors
This table shows a breakdown of the Google Scholar Impact factor that were calculated for each venue in each available year.
Google Scholar Impact Factors for each available year
| Venue | 2000 | 2001 | 2002 | 2003 | Google Scholar Impact Factor |
|---|
| TKDE | 23 | 14 | 15 | 14 | 15 |
| PE | 9 | 11 | 9 | 5 | 8.5 |
| PAMI | 43 | 32 | 36 | 26 | 34 |
| PAA | 11 | 8 | 9 | 7 | 8 |
| ML | 35.5 | 32 | 36 | 29 | 32.5 |
| JACM | 32.5 | 59 | 51.5 | 24.5 | 35 |
| IR | 15 | 8 | 6.5 | 5 | 9.5 |
| INFFUS | 10 | 10.5 | 10 | 6.5 | 9 |
| IJPRAI | 4 | 5.5 | 5 | 3 | 4 |
| IJCV | 36.5 | 13.5 | 27 | 21 | 27 |
| DSS | 17 | 18 | 18 | 17 | 17.5 |
| DKE | 10 | 10.5 | 8 | 6 | 8 |
| CI | 7.5 | 8 | 17 | | 9 |
| ARTMED | 15 | 9.5 | 10 | 12.5 | 12 |
| AIEDAM | 5 | 4 | 6 | 3 | 5 |
| AICOM | 1.5 | 4 | 7.5 | 2.5 | 4 |
| AI | 27 | 22 | 22.5 | 17 | 22 |
| UAI | 17 | 11 | 16 | 10 | 13 |
| TREC | 10 | 10 | 6 | 6 | 8 |
| NIPS | 14 | 13 | 13 | 9.5 | 12 |
| IJCAI | | 20 | | 15 | 17 |
| ICML | 15 | 16 | 11 | 14 | 14 |
| ICCBR | | 9 | | 4 | 6 |
| ICANN | | 3 | 3 | 2 | 3 |
| GECCO | 7 | | 6 | 4 | 5 |
| ECCBR | 8 | | 7 | | 8 |
| ECML | 6 | 10.5 | 7 | 5 | 7 |
| ECCV | 11.5 | | 16 | | 13.5 |
| ECAI | 9 | | 6 | | 7 |
| COLING | 10 | | 8 | | 9 |
| AH | 19.5 | | 16 | | 17 |
| AAAI | 24.5 | | 14 | | 20 |
Table of Available Acceptance Rates
These are the available Acceptance rates and their sources. These acceptance rates were used to generate the
scatterplot above.
The rejection rate is calculated as 100% - acceptance rate. If you have further acceptance rates please send them to
us and we will add new points to our Scatterplot.
Paper conference/type Breakdown
This table shows a breakdown of how many papers of each type are in the database for each conference. If you have more up-to-date values for any of these conferences
we will update the table. We used only full papers in our calculations, when that information was available.
Breakdown of the numbers of different types of paper for each conference, where available
| Conference | Type | Number Of Papers | Google Scholar Impact Factor |
|---|
| AAAI 2000 | Application Paper | 18 | 9 |
| AAAI 2000 | DC Paper | 10 | 0 |
| AAAI 2000 | Demo Paper | 12 | 2.5 |
| AAAI 2000 | Invited Paper | 8 | 4 |
| AAAI 2000 | Robot Competition and Exibition Paper | 1 | None |
| AAAI 2000 | Student Abstract Paper | 36 | 0 |
| AAAI 2000 | Technical Paper | 143 | 24.5 |
| AAAI 2002 | Application Paper | 18 | 10.5 |
| AAAI 2002 | DC Paper | 13 | 0 |
| AAAI 2002 | Demo Paper | 10 | 0 |
| AAAI 2002 | Invited Paper | 2 | 0 |
| AAAI 2002 | Student Abstract Paper | 17 | 4 |
| AAAI 2002 | Technical Paper | 120 | 14 |
| AH 2000 | DC Paper | 4 | 3.5 |
| AH 2000 | Full Paper | 22 | 19.5 |
| AH 2000 | Invited Paper | 1 | 3 |
| AH 2000 | Short Paper | 31 | 5 |
| AH 2002 | Full Paper | 33 | 16 |
| AH 2002 | Invited Paper | 3 | 33 |
| AH 2002 | Poster Paper | 35 | 3 |
| AH 2002 | Short Paper | 23 | 3 |
| COLING 2000 | Not Specified | 174 | 10 |
| COLING 2002 | Not Specified | 198 | 8 |
| ECAI 2000 | Not Specified | 141 | 9 |
| ECAI 2002 | Not Specified | 140 | 6 |
| ECCV 2000 | Not Specified | 116 | 11.5 |
| ECCV 2002 | Not Specified | 226 | 16 |
| ECML 2000 | Full Paper | 43 | 6 |
| ECML 2000 | Invited Paper | 2 | 18 |
| ECML 2001 | Full Paper | 50 | 10.5 |
| ECML 2001 | Invited Paper | 5 | 2 |
| ECML 2002 | Full Paper | 41 | 7 |
| ECML 2002 | Invited Paper | 4 | 19 |
| ECML 2003 | Full Paper | 40 | 5 |
| ECML 2003 | Invited Paper | 4 | 1 |
| ECCBR 2000 | Application Paper | 16 | 6.5 |
| ECCBR 2000 | Invited Paper | 2 | 4 |
| ECCBR 2000 | Research Paper | 26 | 11.5 |
| ECCBR 2002 | Application Paper | 14 | 4.5 |
| ECCBR 2002 | Invited Paper | 2 | 8.5 |
| ECCBR 2002 | Research Paper | 31 | 8 |
| GECCO 2000 | Full Paper | 119 | 9 |
| GECCO 2000 | Poster Paper | 63 | 3 |
| GECCO 2002 | Not Specified | 230 | 6 |
| GECCO 2003 | Full Paper | 200 | 5 |
| GECCO 2003 | Poster Paper | 85 | 2 |
| ICANN 2001 | Invited Paper | 3 | 6.5 |
| ICANN 2001 | Not Specified | 171 | 3 |
| ICANN 2002 | Not Specified | 221 | 3 |
| ICANN 2003 | Not Specified | 140 | 2 |
| ICCBR 2001 | Application Paper | 14 | 4.5 |
| ICCBR 2001 | Invited Paper | 3 | 14 |
| ICCBR 2001 | Research Paper | 36 | 13.5 |
| ICCBR 2003 | Full Paper | 51 | 4 |
| ICCBR 2003 | Invited Paper | 3 | 0.5 |
| ICML 2000 | Not Specified | 150 | 15 |
| ICML 2001 | Not Specified | 80 | 16 |
| ICML 2002 | Not Specified | 87 | 11 |
| ICML 2003 | Not Specified | 116 | 14 |
| IJCAI 2001 | Invited Paper | 3 | 5 |
| IJCAI 2001 | Not Specified | 196 | 20 |
| IJCAI 2003 | Computers and Thought Award Paper | 1 | 29 |
| IJCAI 2003 | Full Paper | 189 | 15 |
| IJCAI 2003 | Intelligent Systems Demonstrations | 9 | 0 |
| IJCAI 2003 | Invited Speakers | 10 | 16.5 |
| IJCAI 2003 | Poster Paper | 87 | 3 |
| NIPS 2000 | Not Specified | 153 | 14 |
| NIPS 2001 | Not Specified | 196 | 13 |
| NIPS 2002 | Not Specified | 207 | 13 |
| NIPS 2003 | Not Specified | 198 | 9.5 |
| TREC 2000 | Not Specified | 74 | 10 |
| TREC 2001 | Not Specified | 84 | 10 |
| TREC 2002 | Not Specified | 100 | 6 |
| TREC 2003 | Not Specified | 100 | 6 |
| UAI 2000 | Not Specified | 75 | 17 |
| UAI 2001 | Not Specified | 71 | 11 |
| UAI 2002 | Not Specified | 69 | 16 |
| UAI 2003 | Not Specified | 77 | 10 |
Acknowledgements
This work has been was supported by Science Foundation Ireland through grants 07/CE/I1147, 04/RPI/1544, 03/CE2/I303 1, and 05/IN.1/I24.
We gathered and generated data using
Python scripts, taking the details of accepted papers from
DBLP and citation figures from
Google Scholar.
Matlab was used to generate the scatterplots.